Why Standard Monitoring Missed Silent Failures
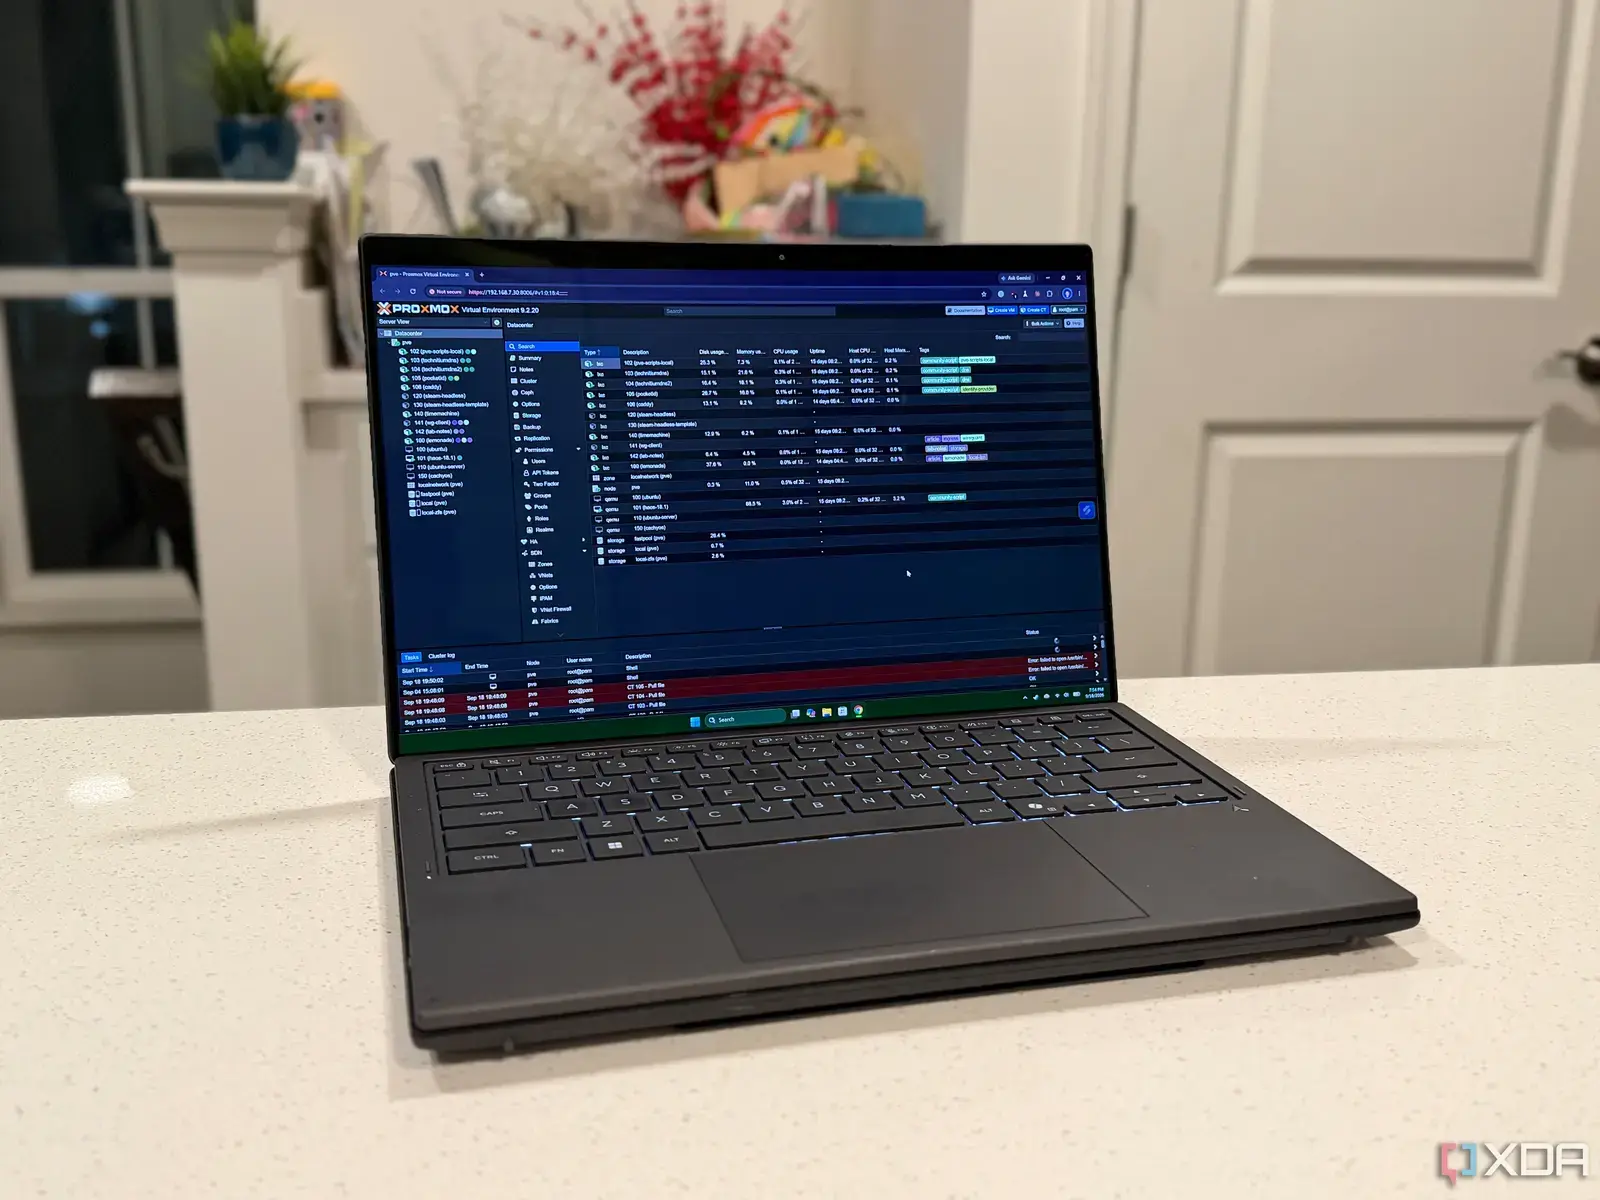
A personal homelab setup ran a container that remained inactive for over two months without triggering alerts from standard monitoring systems. The issue went unnoticed despite the container being part of a regularly used environment, highlighting a gap in how common tools detect silent failures. The discovery came only after manual inspection revealed the container had stopped responding long before any obvious symptoms appeared.
Breaking news
 Trump Orders Federal Agencies to Adopt „Super Intelligence” Terminology
 The Silicon Valley Accountability Gap
 Running a Local AI Model on a Phone Handles Most Chat Prompts
 Google Photos Could Soon Offer a Fresh Start with Ask Photos Feature
The container in question was running a lightweight service that did not generate significant logs or network traffic when idle, making its failure invisible to typical CPU, memory, or uptime checks. Monitoring tools focused on resource consumption rather than functional status, so the absence of activity was interpreted as normal low usage rather than a problem. This meant that even though the service was not performing its intended role, no alerts were fired because the system appeared healthy from a metrics perspective.
How Manual Inspection Uncovered the Real Problem
The core issue lies in how most homelab and production monitoring solutions prioritize observable metrics like processor load, disk I/O, or response times. When a container stops processing but doesn’t crash or consume resources, it can appear dormant rather than defective. In this case, the service was designed to wake up only when triggered, so its inactivity during idle periods mimicked normal behavior. Without application-level health checks or synthetic transactions, there was no way to distinguish between a properly idle service and one that had failed to restart after an update or configuration change.
Upon discovering the container had been inactive for 64 days, further investigation showed the root cause was not the container itself but a misconfigured dependency that prevented it from starting correctly after a routine system reboot. The container’s entry point script relied on a network service that was slow to initialize, causing a race condition that left the main process stuck in a retry loop. Once the dependency timing issue was resolved, the container resumed normal operation without any code changes. This revealed that the monitoring gap was less about the tooling and more about the lack of visibility into startup logic and dependency readiness.
Frequently Asked Questions
Why didn’t alerting systems catch the container failure? Standard monitoring tools track resource usage and basic uptime but do not verify whether a service is actively performing its intended function. A container can be running yet unresponsive, especially if it fails silently during startup or depends on external conditions that aren’t monitored.
What kind of checks could have detected this issue earlier? Implementing application-level health checks, such as HTTP endpoints that return a success status only when the service is fully operational, would have identified the problem. Additionally, monitoring dependency readiness or using init systems that log startup failures could have prevented the prolonged silence.